

Solar Panel Output: How Much Energy Do Panels Produce?
A solar panel’s watt rating tells you its power at a testing moment, not how much energy it will make all day. To estimate solar panel output, convert the panel or system size to kilowatts, multiply by peak sun hours, and account for shade, heat, weather, orientation, and normal system losses. In California, that production must also be matched to when your home uses electricity.
What Is Solar Panel Output?
Solar panel output is the electrical power or energy produced by a photovoltaic panel or system. Watts and kilowatts describe power at a moment in time, while watt-hours and kilowatt-hours describe energy produced over a period. Your utility bill measures kilowatt-hours, so daily and annual kWh are the most useful output figures for planning.
Two measurements are easy to confuse:
- Watts (W) or kilowatts (kW): the rate at which a panel can produce power. A 400-watt panel has a 0.4 kW nameplate rating.
- Watt-hours (Wh) or kilowatt-hours (kWh): the amount of energy produced over time. One kWh equals 1,000 watt-hours.
Think of watts as the width of a water pipe and kWh as the amount of water collected in a bucket. A larger pipe can fill the bucket faster, but the final amount also depends on how long water flows. Solar panel output works the same way: panel rating matters, but sunlight and operating conditions determine the energy collected.
A panel marked 400 W does not produce 400 W from sunrise to sunset. Its nameplate output is measured under standardized test conditions. Actual power changes minute by minute as the sun moves, clouds pass, the panel heats up, and the inverter converts electricity for household use.
How Do You Calculate Solar Panel Output?
A simple solar panel output estimate is: panel power in kW multiplied by peak sun hours multiplied by a system performance factor. For example, a 400 W panel is 0.4 kW. At five peak sun hours and an 80 percent performance factor, it produces about 1.6 kWh for that day: 0.4 x 5 x 0.8 = 1.6 kWh.
Use this three-step calculation for a quick planning estimate:
- Convert watts to kilowatts. Divide the panel rating by 1,000. A 420 W panel becomes 0.42 kW.
- Choose the site’s peak sun hours. This is an equivalent-hours estimate of strong sunlight, not the total hours between sunrise and sunset.
- Allow for real-world losses. Multiply by a performance factor that accounts for temperature, inverter conversion, wiring, soiling, mismatch, and other losses. The example below uses 0.8 only as an illustration, not a guarantee for every roof.
Here is how the same 400 W panel can produce different daily totals under different sunlight conditions:
| Peak sun hours | Output before losses | Illustrative output after 20% losses |
|---|---|---|
| 3 hours | 1.2 kWh | 0.96 kWh |
| 5 hours | 2.0 kWh | 1.6 kWh |
| 6 hours | 2.4 kWh | 1.92 kWh |
These figures are useful for explaining the math, but they are not a production promise. A professional estimate uses the address, roof planes, obstructions, weather data, equipment specifications, and historical electricity use. The U.S. Department of Energy explains that solar radiation varies with season, sun angle, clouds, and atmospheric conditions. Its solar radiation overview provides helpful background.
How Much Energy Does One Solar Panel Produce Per Day?
A modern residential panel may produce roughly 1 to 2 kWh on a typical strong-sun day when it is rated around 400 W, but the result depends on the site. A shaded or cloudy day can be lower, while a clear day with favorable orientation can be higher. Use the panel rating and local conditions, not a universal daily number.
For a 400 W panel, the quick estimate is:
- Three peak sun hours: about 1.2 kWh before losses.
- Five peak sun hours: about 2.0 kWh before losses.
- Six peak sun hours: about 2.4 kWh before losses.
After inverter and other system losses, the usable AC energy will be lower. Panel-level conditions also matter. One panel shaded by a chimney may perform differently from another panel on the same roof. Microinverters and other system choices can help manage some shade patterns, but they do not create sunlight that the array does not receive.
What Are Peak Sun Hours?
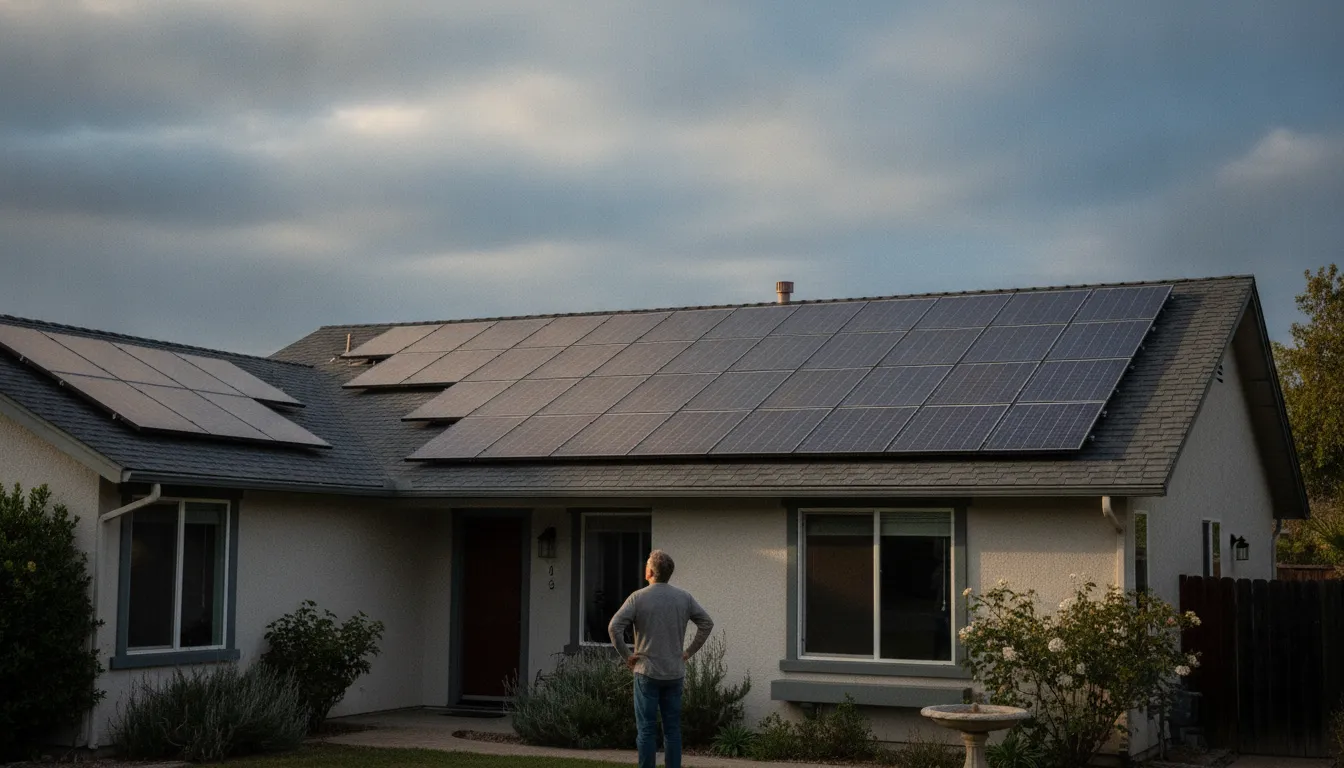
Peak sun hours are a way to express the day’s total solar energy as equivalent hours of strong sunlight. A location with five peak sun hours may receive sunlight across more than five clock hours, but the total energy is roughly equivalent to five hours at a reference intensity. Peak sun hours are used in output estimates and vary by location and season.
Peak sun hours are not the same as daylight hours. A winter day may have plenty of daylight but fewer hours of strong solar radiation. Morning and late-afternoon light can still contribute energy, but at a lower intensity than the middle of the day. Clouds, haze, and local terrain can reduce the total even further.
For a rough calculation, you can use a location-specific estimate. For a serious system design, use a modeling tool that accounts for solar resource and equipment. The National Renewable Energy Laboratory’s PVWatts tool is designed to estimate photovoltaic production from inputs such as system size, array orientation, module type, inverter efficiency, and system losses. The Department of Energy’s PVWatts and SAM guide describes that modeling approach.
Which Factors Change Solar Panel Output?
Solar panel output changes with sunlight, temperature, shade, roof direction, roof tilt, panel condition, equipment, and grid or inverter limits. The biggest design question is not simply how many panels fit. It is how much usable energy the array can produce across the year and whether that production matches the home’s load profile.
Weather and temperature
Clouds reduce the direct sunlight reaching the panel, although diffuse light can still produce some electricity. Haze, smoke, and dust can have similar effects. Solar panels also behave differently as they heat up. A hot, sunny roof may make less power at that moment than the same panel under cooler conditions with comparable sunlight. This is one reason a hot day is not automatically the highest-output day.
Shade and obstructions
Chimneys, trees, neighboring buildings, roof ridges, and new construction can cast shadows over part of an array. The timing matters. A tree that shades panels during a high-production period can reduce annual output more than a brief shadow near the edge of the day. A site assessment should evaluate shade across seasons instead of relying on one midday observation.
Roof orientation and tilt
Roof direction influences when a system produces its energy. In California, a west-facing roof may generate more of its energy later in the day than an east-facing roof, while a south-facing plane may offer a different annual pattern. The best layout depends on the roof, shade, household demand, and design goals. Sun Solar’s California solar panel orientation guide covers this factor in more detail.
Panel condition and system design
Soiling, debris, wiring, inverter conversion, equipment mismatch, and downtime can all reduce delivered energy. A panel’s efficiency rating is related to how much sunlight it converts under test conditions, but efficiency is not the same as total system output. A smaller, efficient panel may help when roof space is limited, while a larger array may produce more total energy if the roof can support it. See the solar panel efficiency ratings explanation for that distinction.
How Does California Time of Use Change the Value of Solar Output?
Solar production and solar value are related but not identical. A California home may produce most of its electricity around late morning and early afternoon, while household demand rises later in the day. Time-of-use rates and the rules for exporting energy can affect when solar power is most valuable, making load shifting and battery storage part of an output conversation.
Consider a simple household pattern: panels produce strongly while the family is away, then the home uses more electricity after work when production is falling. The system may still produce substantial daily kWh, but the home’s bill outcome depends on how much energy is used directly, stored, or exported.
The California Public Utilities Commission explains that the Net Billing Tariff applies to eligible newer customer-sited renewable systems and values exported energy differently from onsite use. Its Net Energy Metering and Net Billing page is the right place to review current program information. Your utility territory and rate plan matter, so do not use a generic online calculator as a promise of savings.
For homeowners in PG&E, SCE, or SDG&E territory, a design conversation should consider both annual production and the timing of production. A battery can store some daytime solar energy for later use, but its size and operating strategy should follow the home’s goals, critical loads, utility plan, and budget. Explore home battery storage options when backup power or evening energy use is part of the plan.
How Large Should a Solar System Be for a Home?
System size should be based on electricity use, roof area, shade, equipment, utility rules, and the homeowner’s goals. As an illustration only, a 6 kW system producing at five peak sun hours with an 80 percent performance factor would estimate about 8,760 kWh per year. Actual production can be higher or lower.
The same formula scales from one panel to a full array:
System output = system size in kW x peak sun hours x performance factor.
Using the illustrative assumptions above:
- 6 kW x 5 hours x 0.8 x 365 days = about 8,760 kWh per year.
- 8 kW x 5 hours x 0.8 x 365 days = about 11,680 kWh per year.
Those examples do not mean every 6 kW or 8 kW system will produce those totals. A professional design compares the estimate with the home’s past bills, future electrification plans, roof constraints, and utility requirements. Adding an electric vehicle, heat pump, or battery can change the load profile and the system conversation.
How Can You Tell If Your Solar Panels Are Producing Normally?
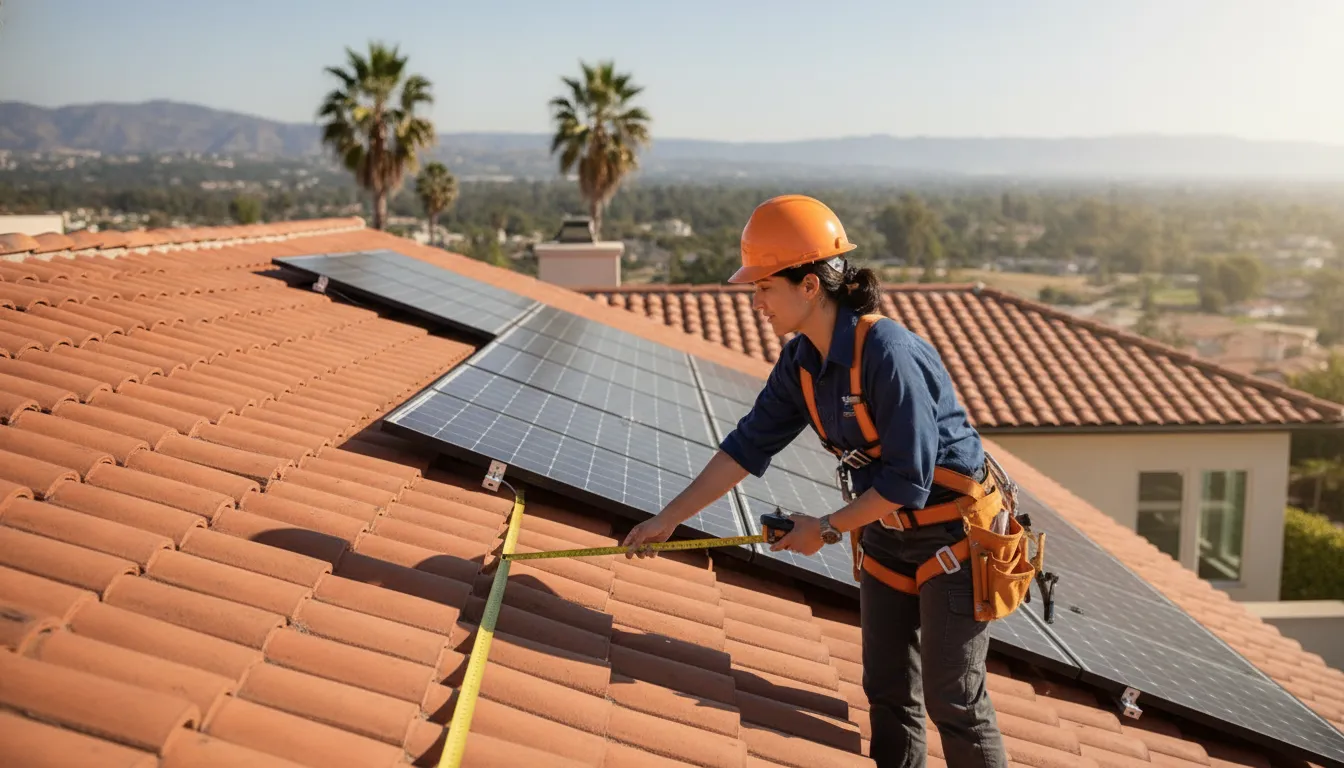
Compare current production with the system’s normal seasonal pattern, weather, and recent household use rather than expecting the same kWh every day. A sudden drop on a clear day can justify a closer look. Monitoring data, inverter alerts, visible shade, and utility records help distinguish normal variation from a problem.
Useful checks include:
- Look for inverter or monitoring alerts and note the date they began.
- Compare several similar weather days instead of one cloudy day with one sunny day.
- Check whether new shade, dust, construction, or vegetation is affecting the array.
- Compare production data with your utility bill, remembering that billing periods and production periods may not line up exactly.
- Call a qualified solar professional when alerts persist, output drops sharply, or electrical equipment needs inspection.
Sun Solar’s guide to monitoring solar panel production explains how homeowners can spot changes. If the system needs hands-on diagnosis, use a professional solar repair service rather than opening electrical equipment yourself.
Solar Panel Output FAQs
The short answer is that solar panel output depends on the panel’s watt rating and the conditions around it. A 400 W panel may produce around 1 to 2 kWh on a strong-sun day after real-world losses, but a site-specific estimate is needed for a reliable annual production expectation.
Is a 400 W solar panel better than a 300 W panel?
A 400 W panel can produce more power at the same test conditions, and it may reduce the number of panels needed for a target system size. That does not automatically make it the best choice. Roof dimensions, shade, equipment compatibility, warranty, cost, and the design’s total annual output all matter.
How many solar panels do I need to produce 1,000 kWh per month?
There is no single panel count without a location, panel rating, roof layout, and performance estimate. As a rough math exercise, a 6 kW array at five peak sun hours and an 80 percent factor produces about 730 kWh in a 30-day month, while an 8 kW array produces about 973 kWh under the same assumptions. Seasonal output varies, so a designer should use annual and monthly modeling rather than divide a yearly goal by one fixed number.
Do solar panels produce power on cloudy days?
Yes, panels can produce electricity from diffuse sunlight on cloudy days, but output is usually lower than on a clear day. Heavy cloud cover, smoke, haze, and rain can reduce production substantially. The useful comparison is the system’s weather-adjusted pattern over time, not a clear-sky expectation for every day.
Does a battery increase solar panel output?
A battery does not make panels generate more sunlight-based energy. It stores some electricity so the home can use it later, which may improve the share of production used onsite and provide backup capability. Battery value depends on storage capacity, charging and discharge limits, the utility plan, household loads, and the system’s control settings.
Where can I find my system’s actual output?
Most modern systems report production through an inverter or monitoring application. Look for daily, monthly, and lifetime kWh, plus alerts or periods of missing data. Your utility bill shows grid imports and exports for a billing period, but it may not show the same categories as the solar monitoring app. If readings look inconsistent, have the system evaluated.
Solar panel output is best understood as an estimate built from several connected pieces: panel rating, sunlight, roof conditions, system losses, household demand, and utility rules. Use the formula to understand the basics, then rely on a site-specific design when you are deciding how many panels to install or whether battery storage belongs in the system.